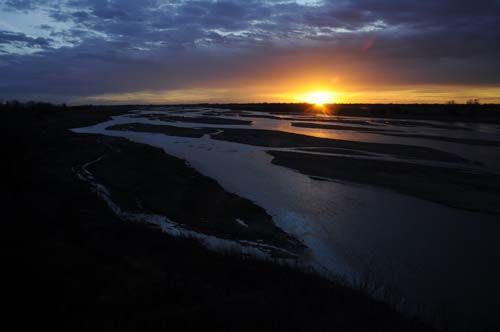
Fig.3. Dissolved oxygen concentration in the Platte River at Rowe River Channel, Gibbon, Nebraska over one week in May 2014. This timelapse data sequence depicts the diel variation of dissolved oxygen and provides a framework to discuss biological processes, such as photosynthesis. As you hover on the graph the image to the right changes to correspond with the data.