Time-lapse Data Sequences
visualizing a river system through the integration of
time-lapse imagery and data visualization
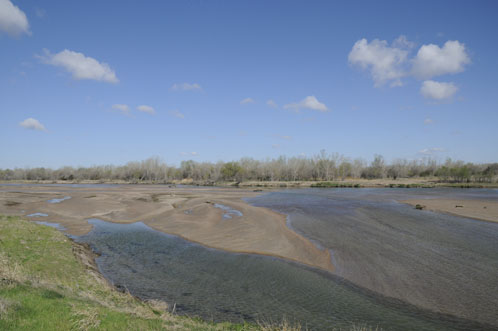
Fig. 2. Streamflow in cubic feet per second in the central Platte River, Nebraska from March 1-9, 2014. The site is located downstream from a hydroelectric power plant with controlled water releases.